Results
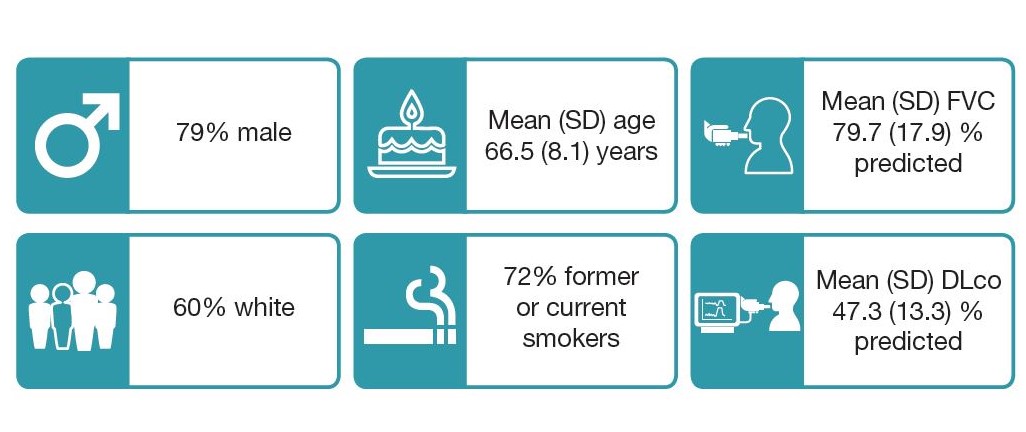
Baseline characteristics

Progression events

Data are % of patients. Chi-squared test was used to calculate p-values.
Number of progression events

Data are % of patients.
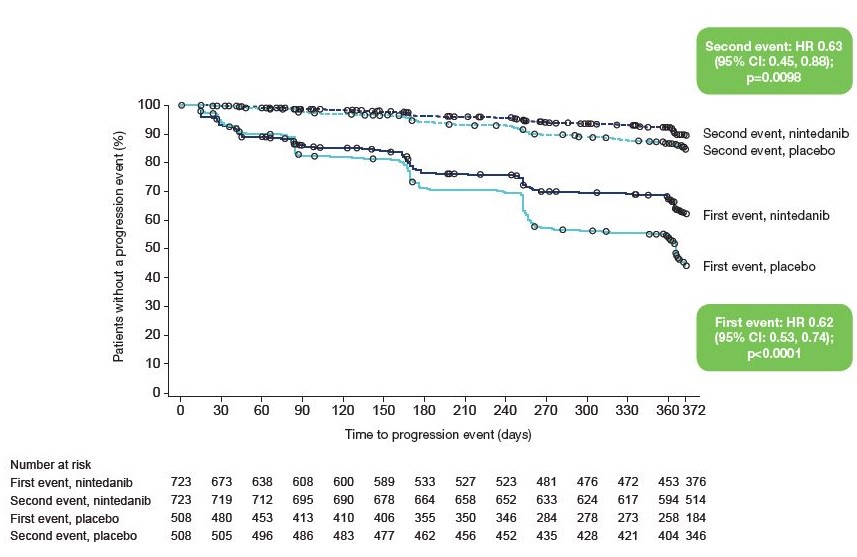
Time to first and second progression events
- Nintedanib significantly reduced the risk of a first and second progression event compared with placebo.

A log-rank test was used to compare treatment groups and a Cox model was used to determine hazard ratios.
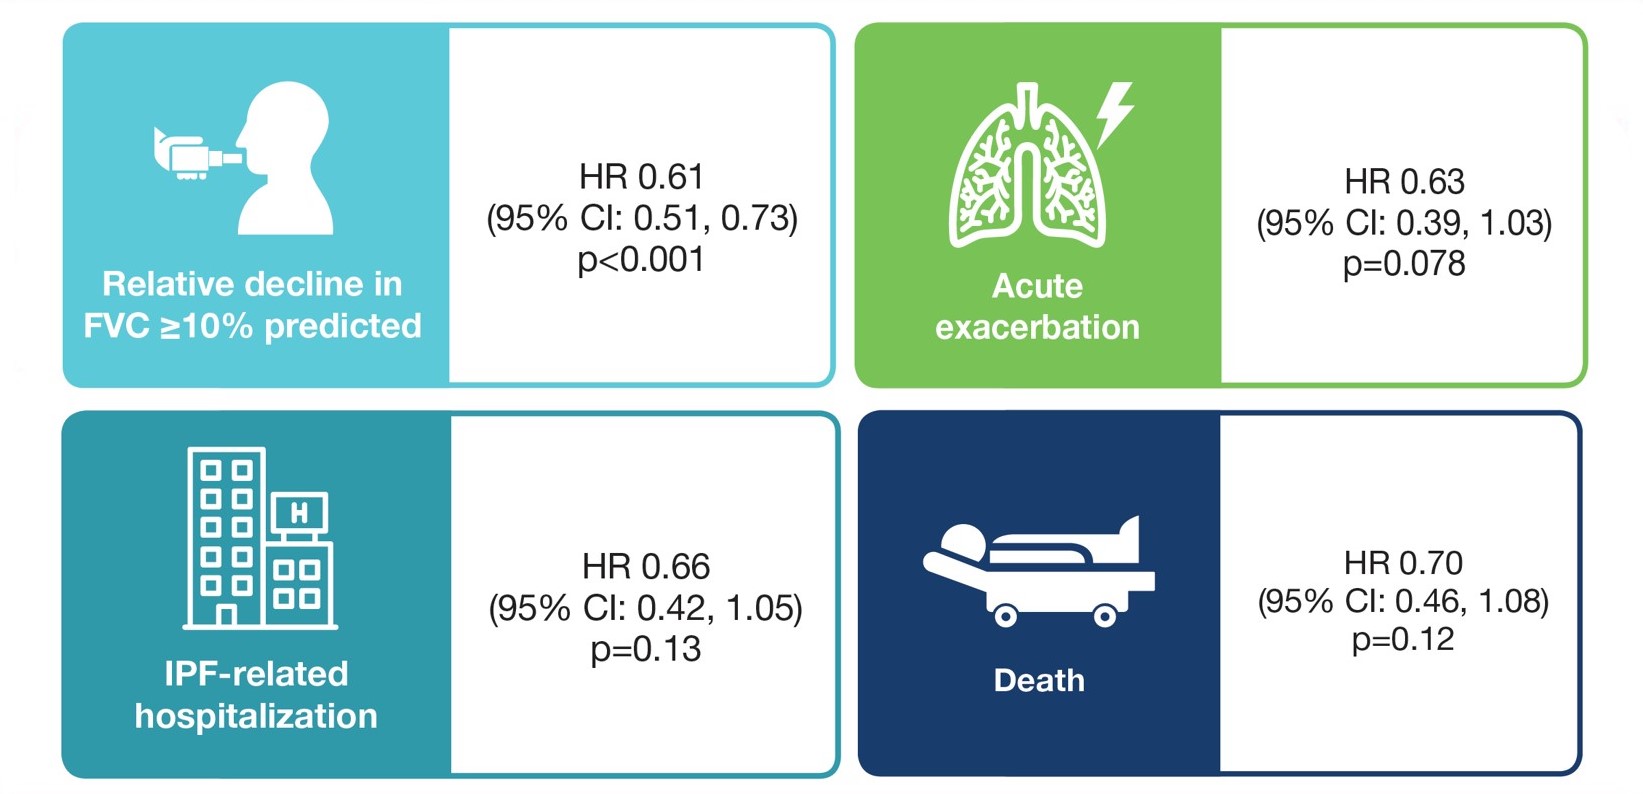
Time to first progression event by type of event

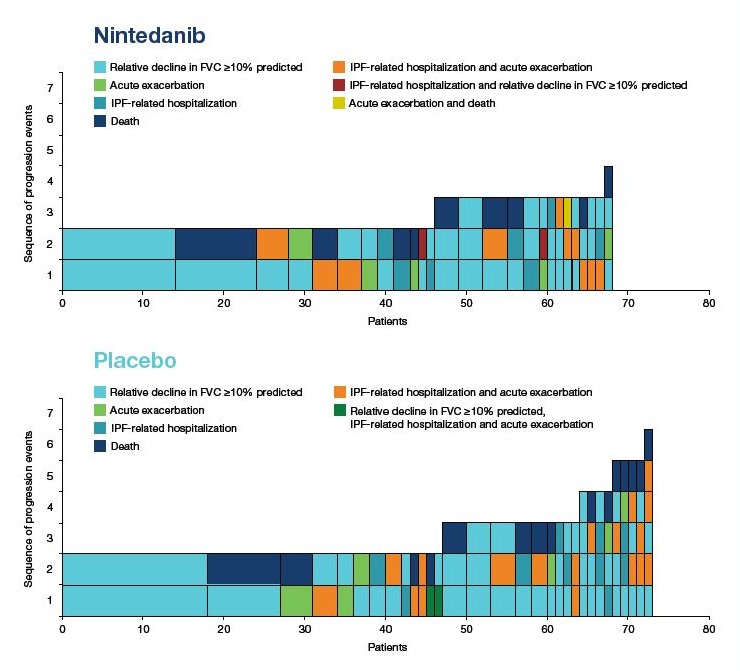
Incidence and sequence of multiple disease progression events up to 52 weeks in patients who had >1 event
- The below figures show the number of patients with each sequence of progression events. The box at the bottom of the column represents the event that occurred first, the next box up the next event that occurred, and so on.
