Results
Subjects
Baseline characteristics of subjects in the highest and lowest tertiles of FVC % predicted
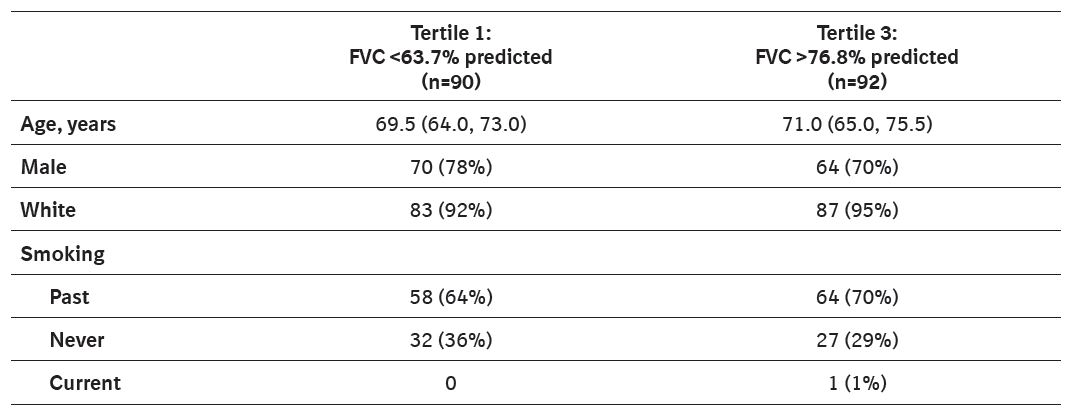
Values are median (Q1, Q3) or n (%).
Differential expression of mRNAs and microRNAs
- Of 35628 mRNAs and 2576 microRNAs sequenced, 2441 and 214, respectively, met the criteria for differential expression between subjects in the lowest versus the highest tertile of FVC % predicted.
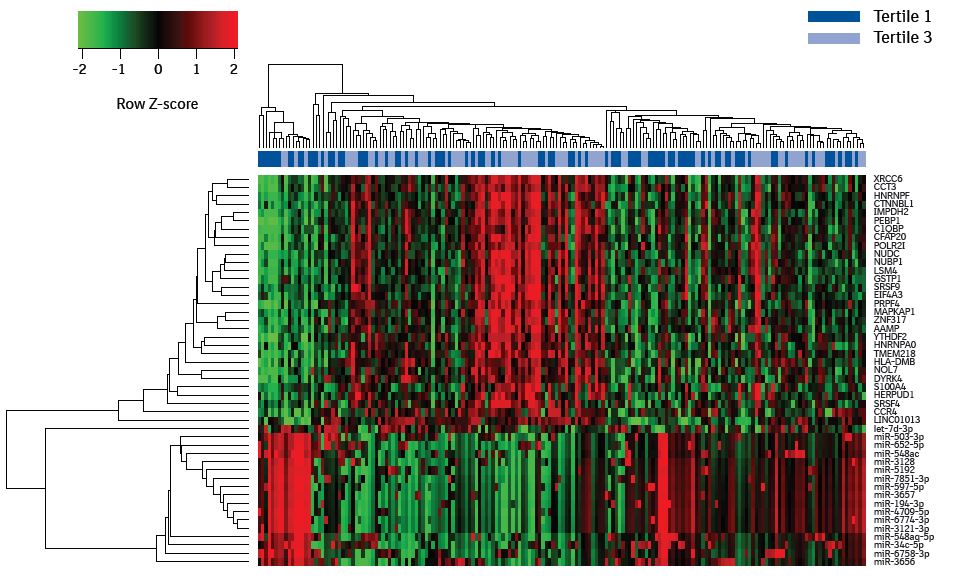
- A cluster heatmap showed sub-clusters of expression among the top mRNA-microRNA pairs from the differentially expressed mRNAs and microRNAs.
Top mRNA-microRNA pairs from the mRNAs and microRNAs differentially expressed between subjects in the highest and lowest tertiles of FVC % predicted
- The mRNA-microRNA pair with the strongest negative correlation was the nucleotide binding protein 1 (NUBP1) transcript and the microRNA hsa-mir-5192 (r=-0.37; p=1.03e-07):
mRNA-microRNA pair with the strongest negative correlation
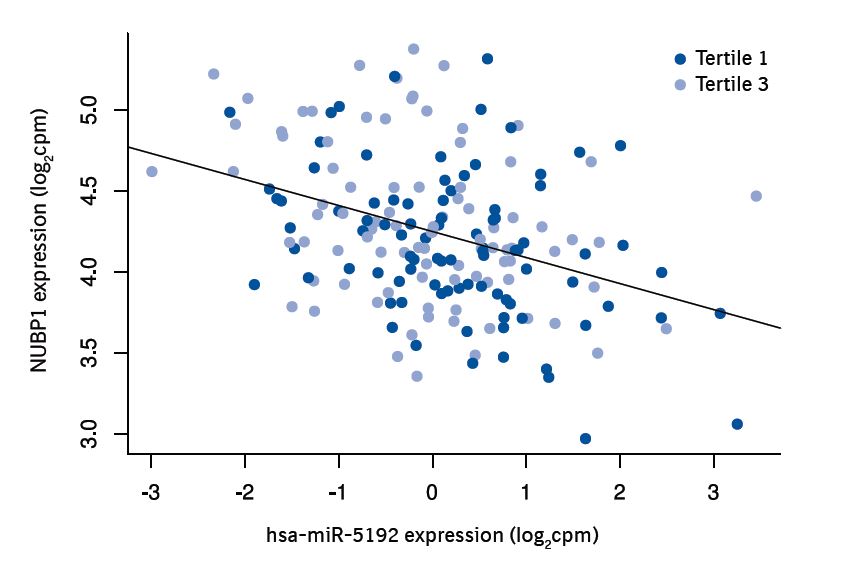
cpm, counts per million.
Functional analyses
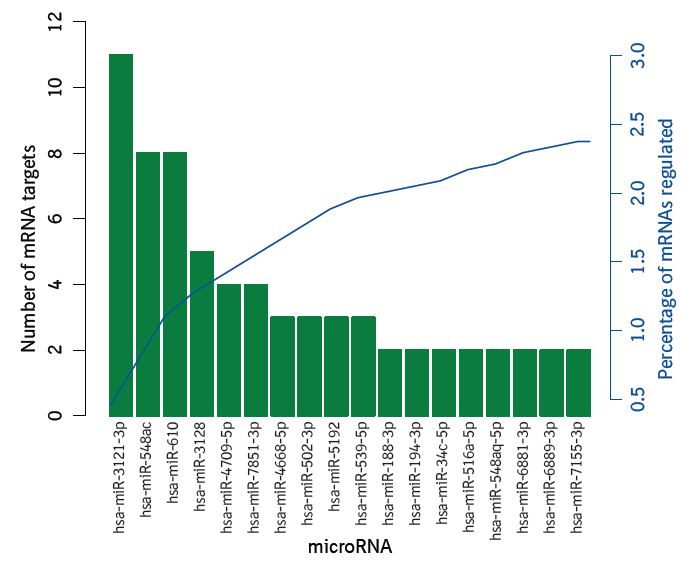
MicroRNAs with ≥2 mRNA targets with adjusted p≤0.05, and cumulative percentage of 2441 differentially expressed mRNAs regulated by each microRNA
Network analyses
Network of mRNA-microRNA interactions with adjusted p≤0.05
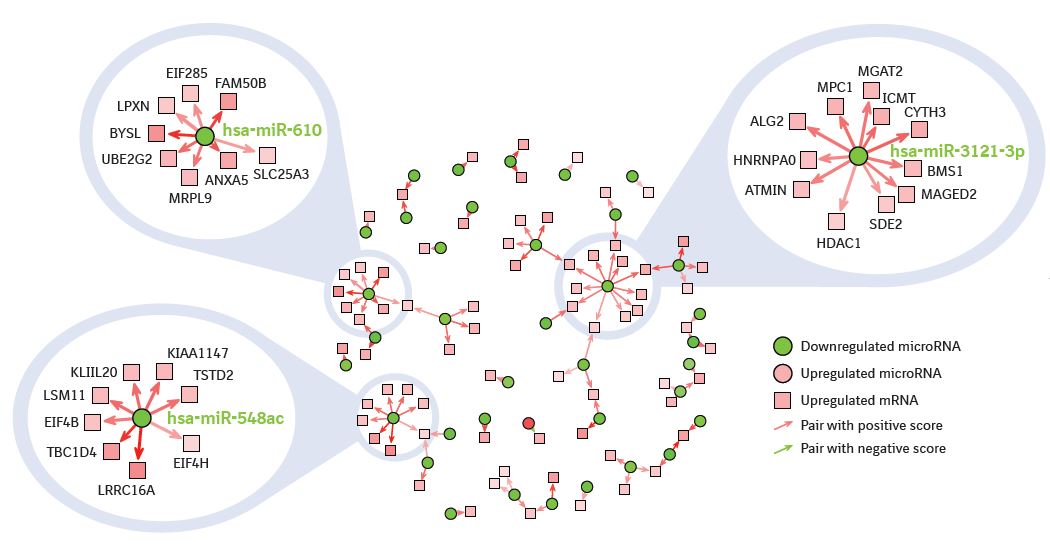
Darker shades in squares or circles indicate stronger up- or downregulation. Darker shades of arrows indicate connections were found in a greater number of the databases searched.
Pathways analysis
mRNA-microRNA pairs with a confirmed connection in ≥1 database searched
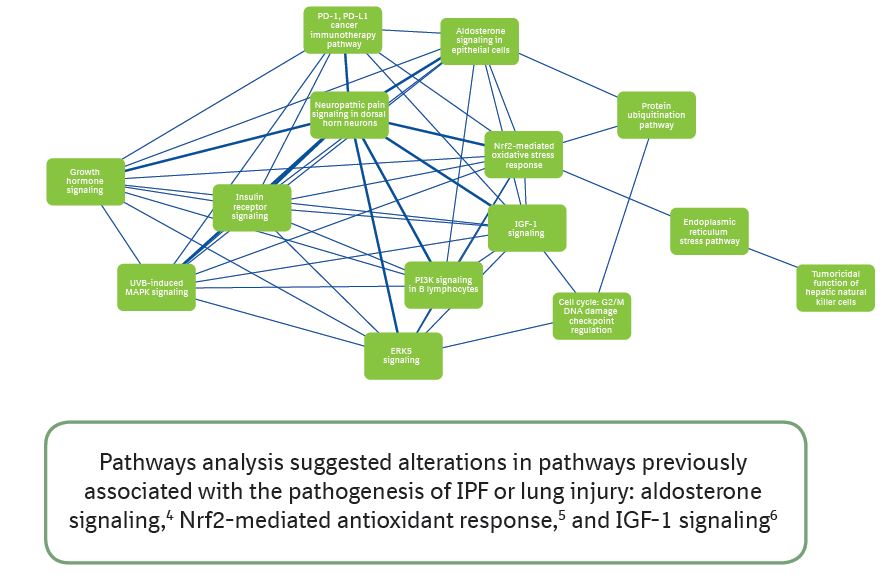
IGF-1, insulin-like growth factor 1;
Nrf2, nuclear factor E2-related factor 2.
