Results
Table 1: Baseline characteristics of subjects in the INMARK trial
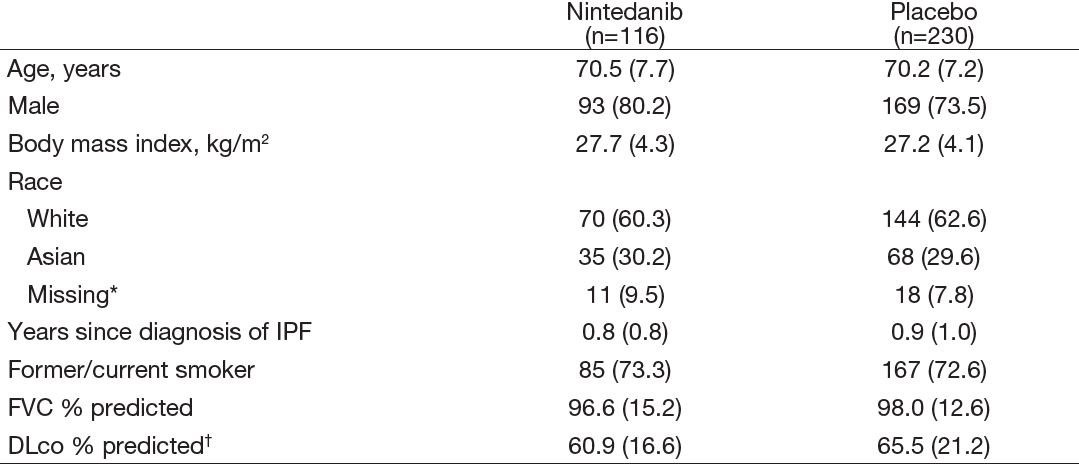
Data are n (%) or mean (SD). *Data on race were not collected in France due to local regulation. †Corrected for hemoglobin.
- Data from 327 subjects (110 randomized to nintedanib, 217 to placebo) were analyzed.
- Of 60,675 genes evaluated, 14,799 had counts per million ≥1 in at least half the samples from either treatment group at every time point and were included in the analysis.
Changes in gene expression
- In adjusted analyses, after 12 weeks of treatment:
- Nine genes were downregulated in the nintedanib group while none was downregulated in the placebo group (Figure 1).
- The change at week 12 was significantly different between nintedanib and placebo for one gene (SHISA4).
- No genes were upregulated in either treatment group.
- In unadjusted analyses, the change in expression at week 12 was significantly different between nintedanib and placebo for five genes: SHISA4, LTF, CTSG, OLFM4, DEFA4 (Table 2).
Figure 1: Changes in gene expression from baseline at week 12 (adjusted analyses)
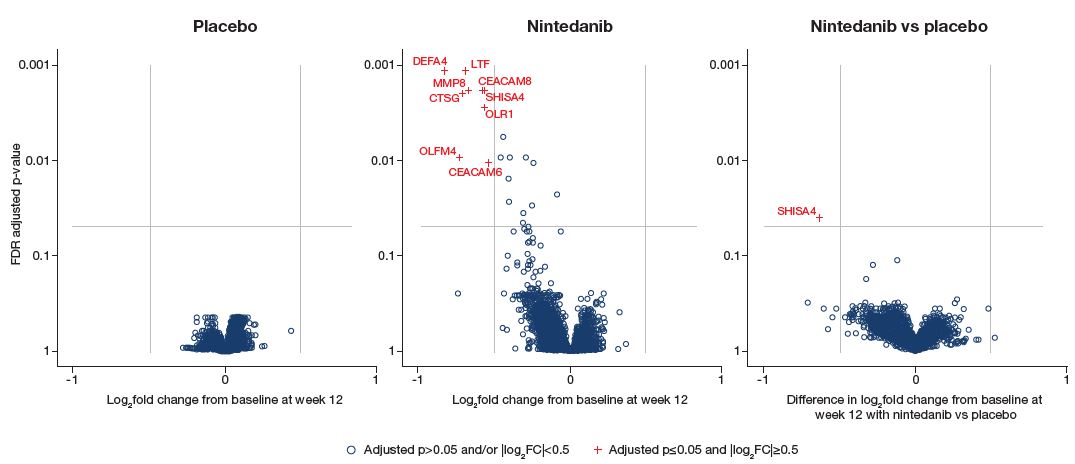
CEACAM6/8, carcinoembryonic antigen related cell adhesion molecule 6/8; SHISA4, shisa family member 4; OLR1, oxidized low density lipoprotein receptor 1; MMP8, matrix metalloproteinase 8; LTF, lactotransferrin; CTSG, cathepsin G; OLFM4, olfactomedin 4; DEFA4, defensin alpha 4.
Table 2: Nine genes downregulated at week 12 (with adjusted p≤0.05 and |log2fold change|≥0.5) in subjects treated with nintedanib
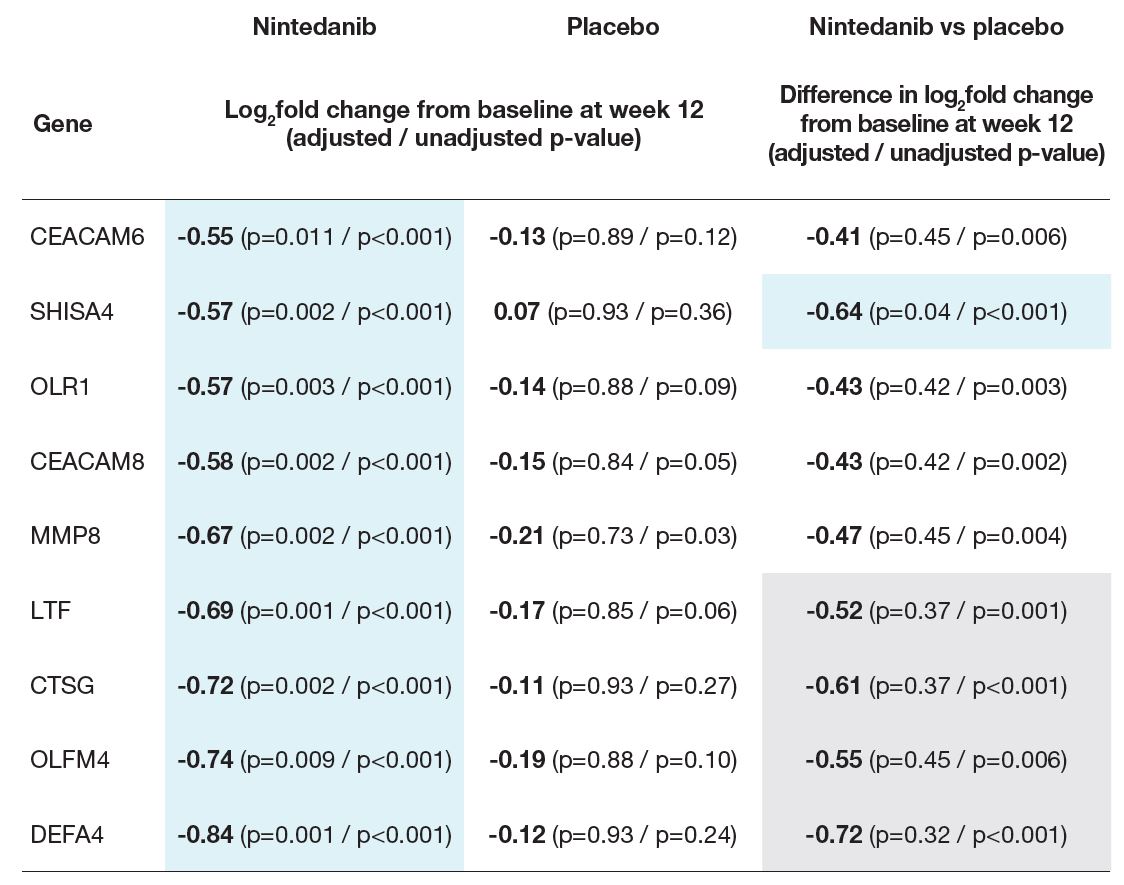
Blue shading: |log2fold change|≥0.5 and adjusted p≤0.05.
Grey shading: |log2fold change|≥0.5 and unadjusted p≤0.05.
- Figure 2 shows the expression of the nine genes that were downregulated at week 12 (with adjusted p≤0.05 and |log2fold change|≥0.5) in subjects treated with nintedanib.
Figure 2: Expression of the nine genes downregulated at week 12 in subjects treated with nintedanib
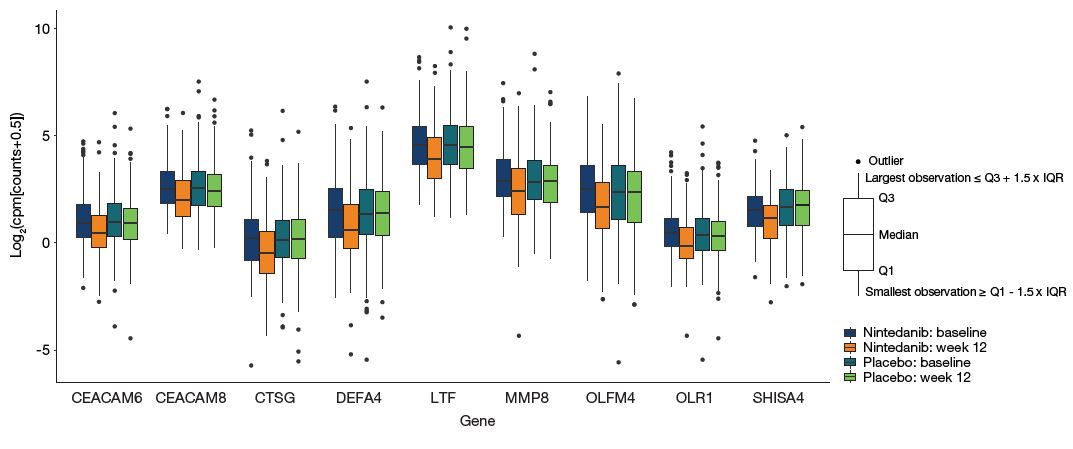
cpm, counts per million; IQR, interquartile range.
Gene set variation analysis
- Gene set variation analysis was performed on the set of nine genes downregulated at week 12 in subjects treated with nintedanib.
- Between baseline and week 12, genes in this set were positively enriched compared with genes not in this set among subjects treated with nintedanib but not among subjects treated with placebo (Figure 3). Changes in enrichment scores between baseline and week 12 were significantly different between nintedanib and placebo (p=0.020).
Figure 3: Gene set variation analysis enrichment scores for the set of nine genes downregulated at week 12 in subjects treated with nintedanib
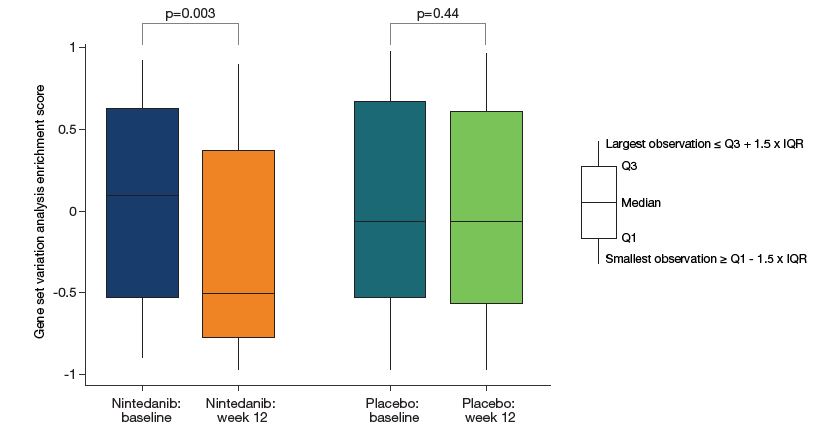
cpm, counts per million; IQR, interquartile range.
Pathways analysis
- Based on EnrichR, of the nine genes downregulated at week 12 in subjects treated with nintedanib, all except SHISA4 are known to be linked to neutrophil function, extracellular matrix organization and/or antibacterial/antiviral immunity (Figure 4). The EnrichR databases did not hold information on SHISA4.
Figure 4: Functional pathways linked to genes downregulated at week 12 in subjects treated with nintedanib based on EnrichR
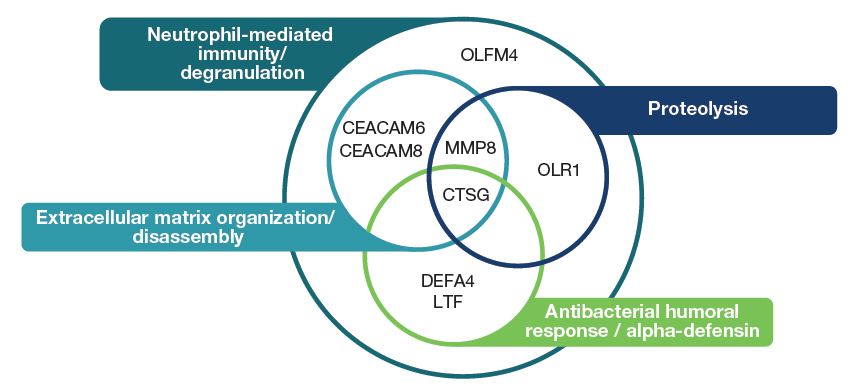
CEACAM6/8, carcinoembryonic antigen related cell adhesion molecule 6/8; CTSG, cathepsin G; DEFA4, defensin alpha 4; LTF, lactotransferrin; MMP8, matrix metalloproteinase 8; OLFM4, olfactomedin 4; OLR1, oxidized low density lipoprotein receptor 1.
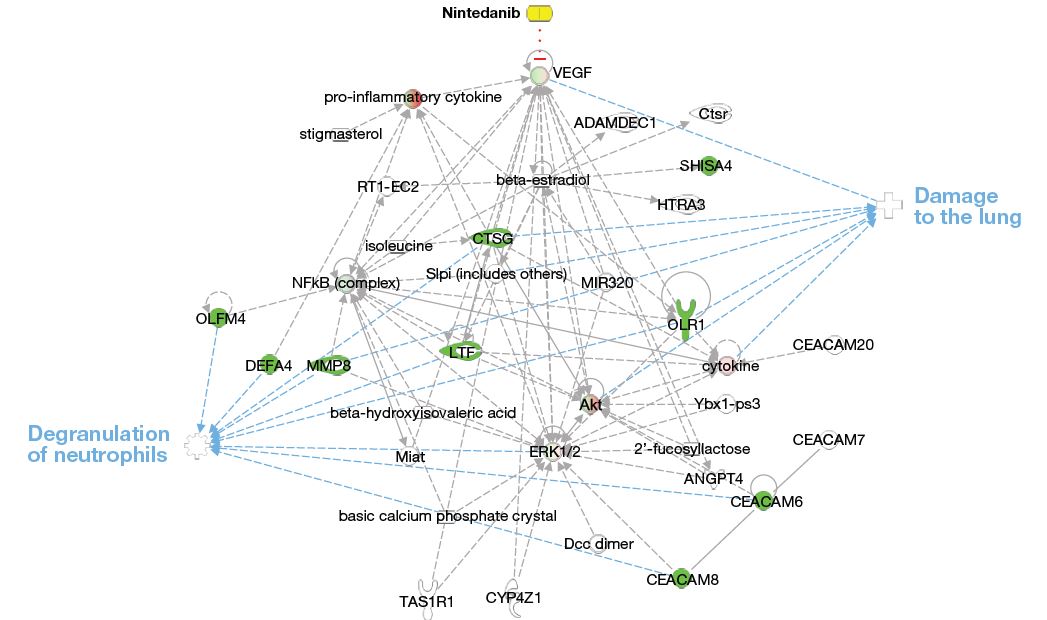
- The network of these nine genes created using Ingenuity Pathway Analysis software showed enrichment of genes related to neutrophil degranulation and lung damage (Figure 5).
Figure 5: Network of the set of nine genes downregulated at week 12 in subjects treated with nintedanib