Results
Patient characteristics at enrollment (n=300).

Values are median (Q1, Q3) or n (%).
Figure 1: Kaplan-Meier curve for the composite of respiratory death or lung transplant.
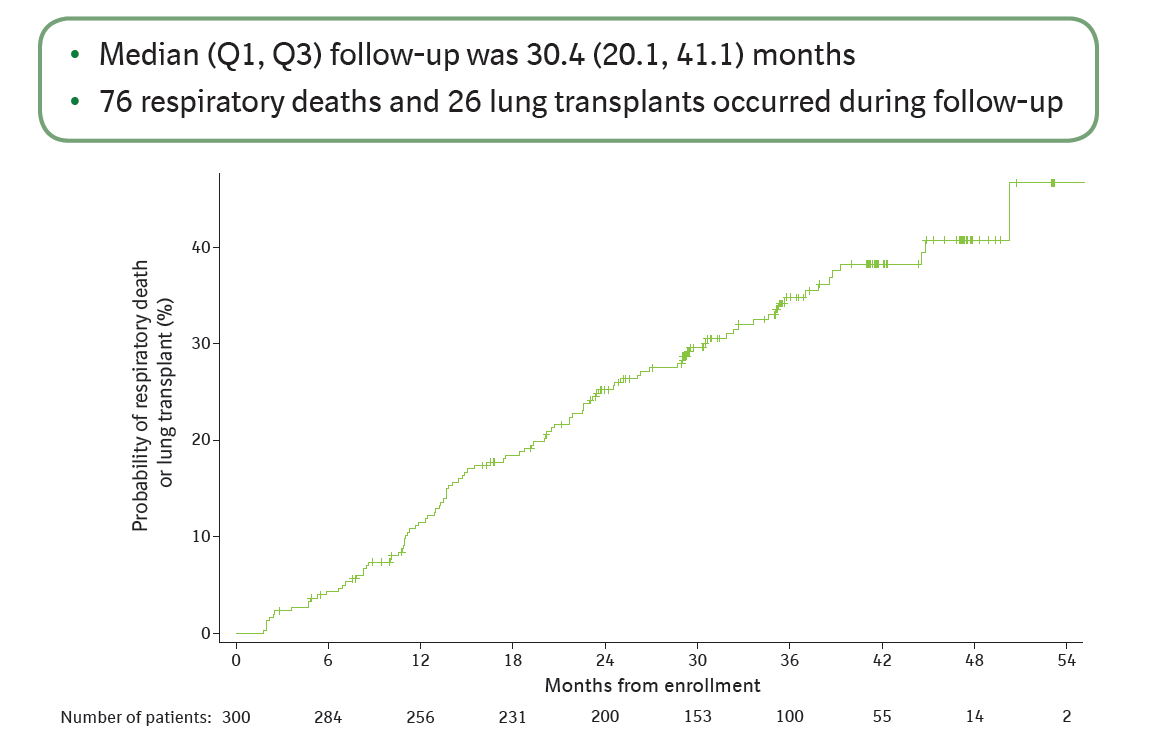
Figure 2: Unadjusted analyses of associations between each protein and composite of respiratory death or lung transplant.
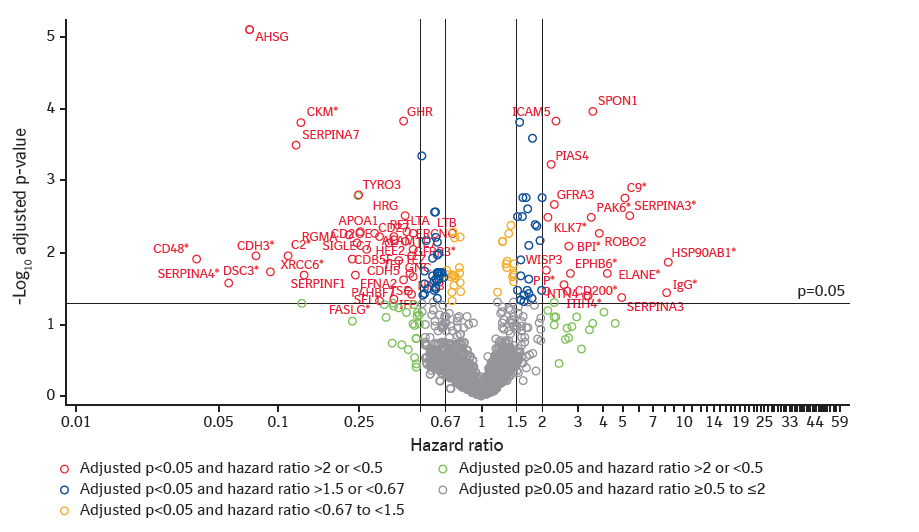
*Analyte failed linearity or proportional hazards assumption. For analytes that failed the linearity assumption, the hazard ratio associated with the maximum relative effect from 2-3 piece-wise linear (PWL) components used to represent this analyte is shown. For analytes that failed the proportional hazards assumption, the time-dependent hazard ratio associated with the maximum relative effect at 12, 24, or 36 months is shown. For analytes that failed both, the maximum hazard ratio associated with PWL components at 12, 24, or 36 months is shown.
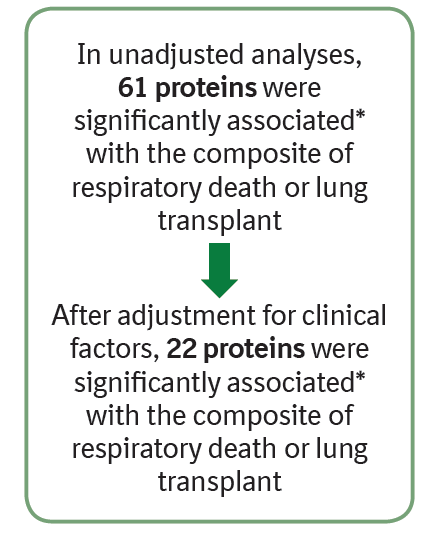
*Hazard ratio >2 or <0.5 and adjusted p<0.05.
Multivariable analyses of predictors of respiratory death or lung transplant: model performance metrics
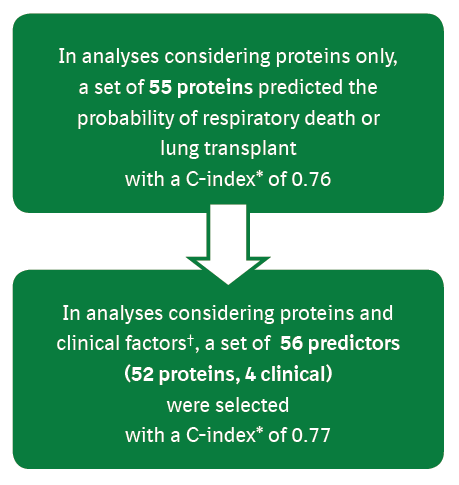
*Corrected for optimism.
†Sex, age, FVC % predicted, DLco % predicted, oxygen use at rest, oxygen use with activity (all assessed at enrollment).
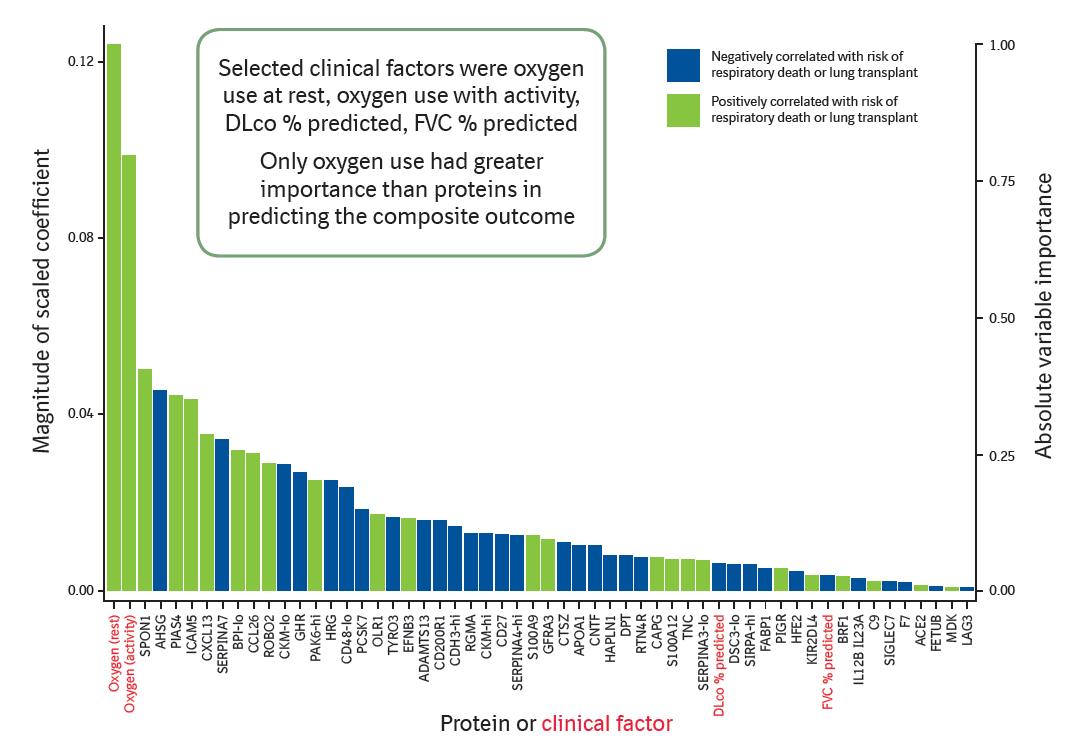
Variable importance of predictors of respiratory death or lung transplant
Figure 3: Model considering proteins only as predictors of respiratory death or lung transplant.
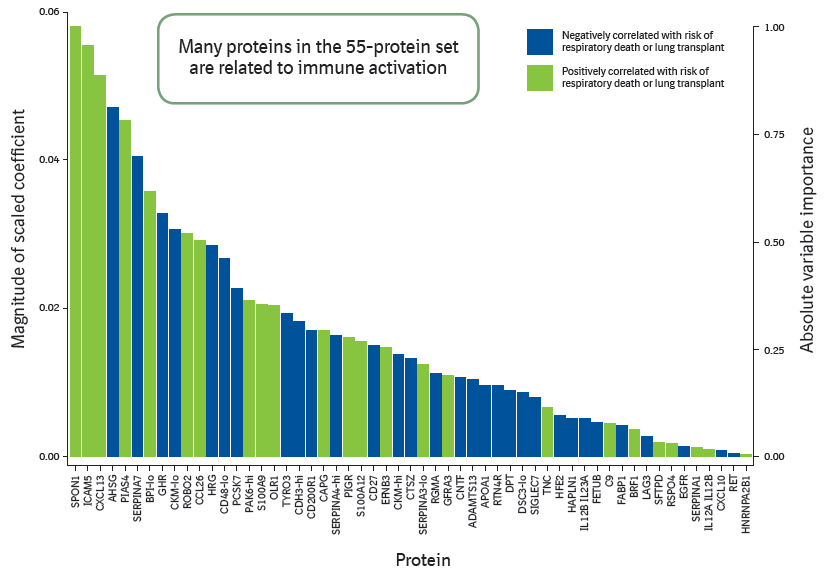
Figure 4: Model considering proteins and clinical factors as predictors of respiratory death or lung transplant.
